Deploy a Kubernetes Cluster Metrics Stack
This document demonstrates the process of deploying and using a sample open-source monitoring stack in a Kubernetes cluster.
| The resulting environment is not production-ready. It is only intended to show how Ping software can produce metrics for consumption by a popular open-source monitoring system. This example stack is not maintained or directly supported by Ping. |
Stack Components
Open Source Tools
-
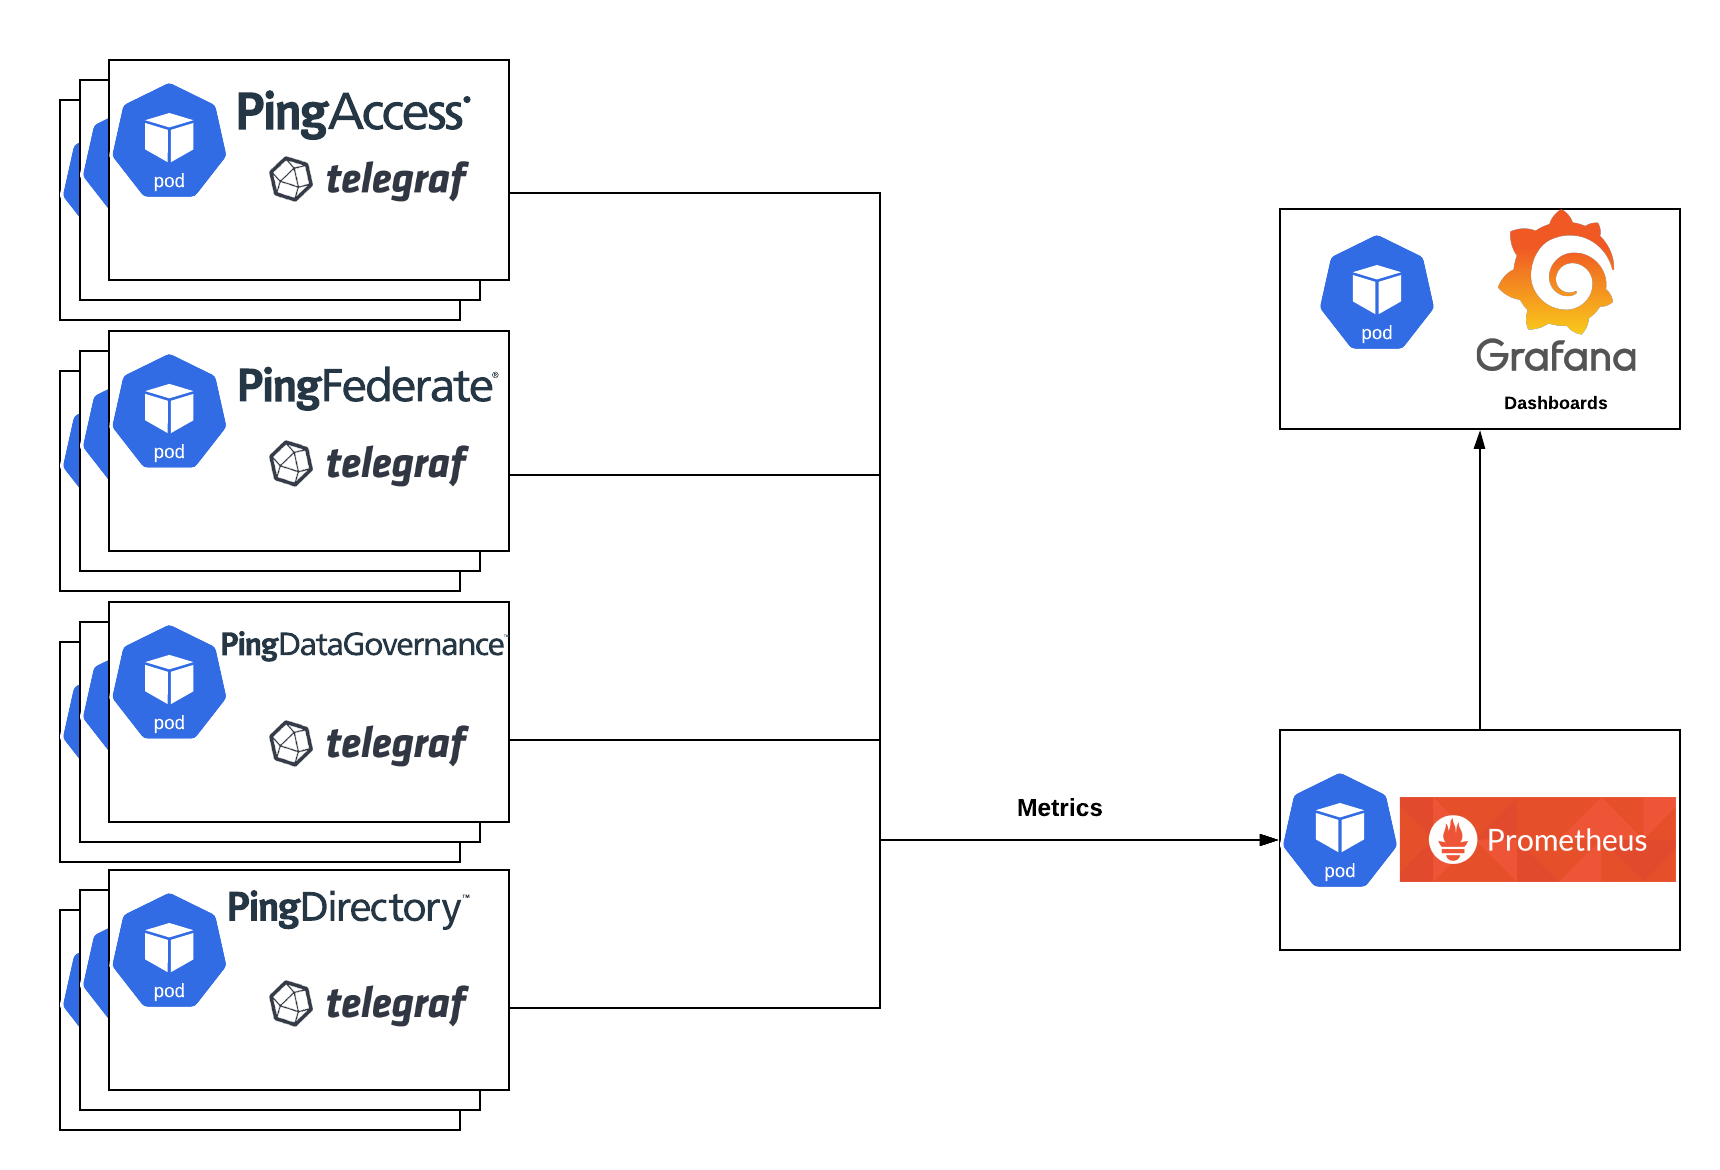
kube-prometheus-stack, which includes:
-
Prometheus - Metrics collection and storage
-
Grafana - Metrics visualization in Dashboards
-
telegraf-operator - Metrics exposure and formatting
-
Grafana Dashboard - JSON file to import for dashboard definition
Ping-provided values.yaml - Values relevant to exposing metrics for Ping Identity software
Prerequisites
-
Familiarity with the prerequisites for the base Helm examples
-
Working knowledge of Prometheus, Grafana, and Telegraf
Deploy the Stack
In the pingidentity-devops-getting-started/30-helm/cluster-metrics directory of this repository, edit the 01-prometheus-values.yaml as needed. This file provides configurations beyond the default kube-prometheus-stack. In this sample deployment, the monitoring stack is granted read access to the entire cluster and is deployed into the metrics namespace.
| Altering these settings or making the deployment production-ready is beyond the scope of this document. The full set of optional values can be found on the Github repository for the Prometheus chart. |
There are numerous lines that have ##CHANGEME. These lines should be considered for configuration options to meet your needs.
After updating the file, deploy the kube-prometheus-stack. The path to the configuration file assumes you are in the root folder of a local copy of the Getting Started repository:
kubectl create namespace metrics

helm repo add prometheus-community https://prometheus-community.github.io/helm-charts

helm repo update

helm upgrade --install metrics prometheus-community/kube-prometheus-stack -f 30-helm/cluster-metrics/01-prometheus-values.yaml -n metrics --version 57.2.0
Deploy telegraf-operator:
helm repo add influxdata https://helm.influxdata.com/

helm upgrade --install telegraf influxdata/telegraf-operator -n metrics --version 1.3.11 -f 30-helm/cluster-metrics/02-telegraf-values.yaml
Telegraf operator makes it very easy to add monitoring sidecars to your deployments. All you need to do is add annotations, which are shown in 30-helm/cluster-metrics/03-ping-with-metrics-values.yaml
These values can be copied to your values.yaml manually, or the file can be referenced at the end of your helm install command. For example:
helm upgrade --install ping-metrics pingidentity/ping-devops -f my-values.yaml -f 30-helm/cluster-metrics/03-ping-with-metrics-values.yaml
After the Ping software is healthy and producing metrics, there should be sidecars on Ping pods.
NAME                                                 READY   STATUS
ping-metrics-pingaccess-admin-0                      1/1     Running
ping-metrics-pingaccess-engine-68464d8cc8-mhlsv      2/2     Running
ping-metrics-pingdataconsole-559786c98f-8wsrm        1/1     Running
ping-metrics-pingdirectory-0                         2/2     Running
ping-metrics-pingfederate-admin-64fdb4b975-2xdjl     1/1     Running
ping-metrics-pingfederate-engine-64c5f896c7-fn99v    2/2     Running
Note the 2/2 indicator for pods with sidecars.
View Metrics
Browse to Grafana using the Ingress URL or by running a kubectl port-forward command. For example: kubectl port-forward svc/metrics-grafana --namespace metrics 9000:80.
In your browser, navigate to http://localhost:9000 and log in with the user admin and the password set in 01-prometheus-values.yaml.
Finally, import the 04-ping-overview-dashboard.json using the New button at the top right of the Dashboard landing page in Grafana.
The Ping Identity Overview dashboard will have a dropdown for namespace at the top. Select the namespace running Ping products to see something similar to this example:
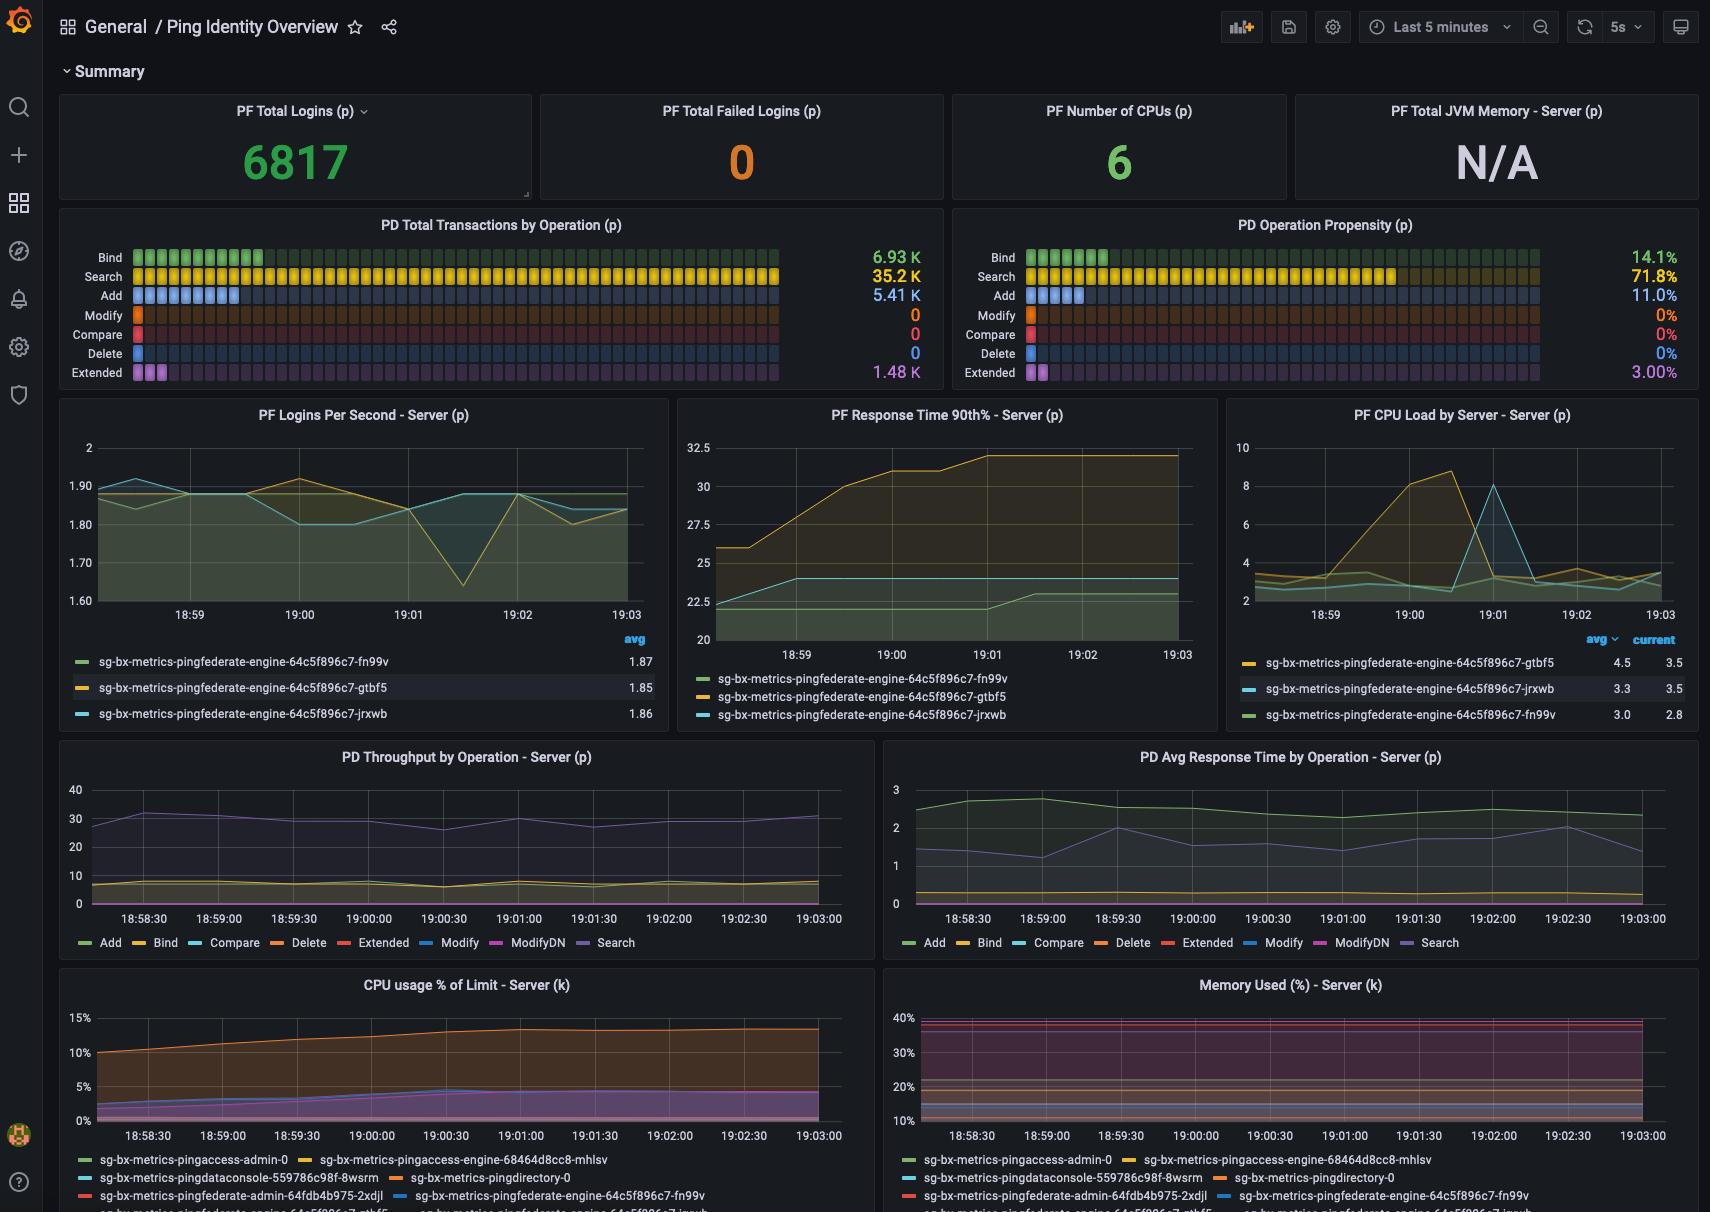
Any of the panels can be edited, or new ones created to fit your needs.
HorizontalPodAutoscaler
If you use the autoscaling/v2 API version, you can configure a HorizontalPodAutoscaler to scale based on a custom metric not built in to Kubernetes or any Kubernetes component. If you are using our Helm Charts, you can pass the custom metrics under global.cluster.autoscalingMetricsTemplate. The example code here will scale on a requests-per-second threshold of 10,000:
  - type: Pods
    pods:
     metric:
       name: custom-metric
     target:
       type: AverageValue
       averageValue: 10000m
  - type: Resource
    resource:
      name: cpu
      target:
        type: Utilization
        averageUtilization: 50
  - type: Object
    object:
      metric:
        name: requests-per-second
      describedObject:
        apiVersion: networking.k8s.io/v1
        kind: Ingress
        name: main-route
      current:
        value: 10k
In addition, you can define the behaviors for scaling up and down under global.cluster.autoscaling.behavior.
  scaleDown:
    stabilizationWindowSeconds: 300
    policies:
    - type: Percent
      value: 100
      periodSeconds: 15
  scaleUp:
    stabilizationWindowSeconds: 0
    policies:
    - type: Percent
      value: 100
      periodSeconds: 15
    - type: Pods
      value: 4
      periodSeconds: 15
    selectPolicy: Max
For more information on custom HPA metrics please visit Kubernetes